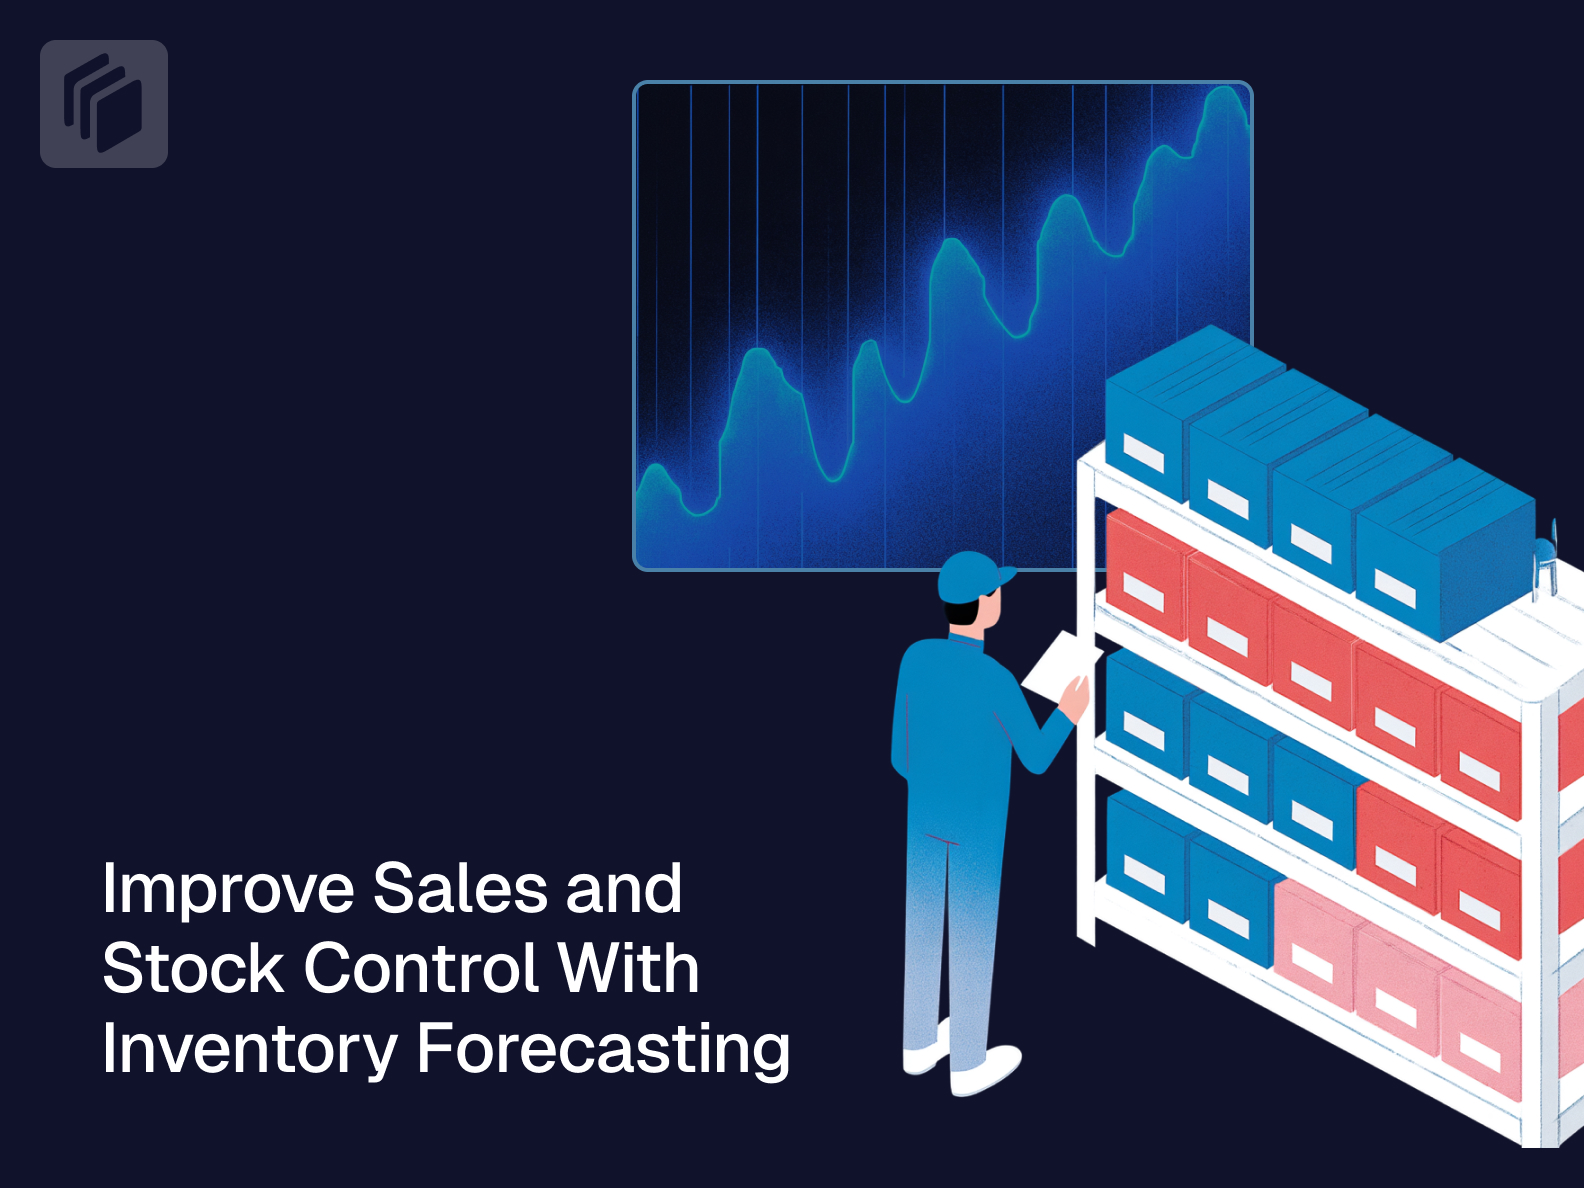
For successful sales, your products must be available when customers are ready. They may not wait for out of stock items to arrive, yet you don’t want more inventory than you can move. Striking the right balance requires reliable inventory forecasting methods.
Inventory forecasting takes demand forecasting models one step further. While demand forecasting models predict consumer wants and buying behavior, inventory forecasting considers those things plus logistical factors, such as how much time production and delivery take.
Choosing the right inventory forecasting system for your brand and implementing it wisely directly impacts your sales volume and velocity, so you need to make informed choices.
What you’ll learn:
-
Why inventory forecasting matters
-
What inventory forecasting methods are available, what each requires, and when to use them
-
What MAPE: Mean Absolute Percentage Error is and why it’s relevant to retail brands
-
How automating forecasting with AI helps, and why human judgement is still critical
Why Inventory Forecasting Matters
When an item is out of stock, some customers stay loyal to the brand or company and look for a similar substitute. But if they don’t want a substitute or one isn’t available, most customers will buy from a competitor, not wait — up to two-thirds of customers will walk away, whether they’re shopping in-store or online.
Customers who buy from someone else may switch brands for good. This loses future sales, not just today’s sale. Since gaining new customers takes more time and effort than selling to return buyers, losing loyalty also slows down your sales cycle.
On the flip side, overstocking can drive up production and storage costs, creating expenses you won’t offset with revenue if your products don’t sell quickly enough.
Inventory forecasting methods can help you predict how much stock you’ll need and when, helping you plan for predictive replenishment to prevent stockouts without driving up unnecessary expenses.
What Is Predictive Replenishment?
Predictive replenishment means looking at factors that could influence your need for more product to determine when to restock, instead of ordering on a set schedule or when inventory reaches a pre-designated level.
It uses AI data analysis, considering factors such as marketing campaigns, seasonality, typical sales velocity of specific items, lead time needed, and current and historical consumer trends and behaviors.
This isn’t a set it and forget it process. Changes in demand or supply logistics occur in real time. You need to be able to see those changes and respond quickly to prevent stockouts, not just fix them when they occur.
Understanding Inventory Forecasting Methods, What Data They Require, and When to Use Them
Here’s an overview of four of the common inventory forecasting methods. Each requires data, which may be generated by your company’s historical and current sales, from external factors that impact demand and logistics, or through research.
Quantitative Forecasting
Quantitative forecasting is a method that’s based on actual historical data, preferably larger quantities of data covering at least a year.
That data may be calculated and analyzed in different ways and may consider external factors in the analysis.
One type, barometric analysis, bases forecasts on historical and existing data, but may also look at other factors such as external indicators. For example, a rise in pregnancy rates might trigger higher demand for baby shower and newborn retail items, while new house building permits might indicate a rise in building supplies or, farther down the road, interior decor.
Another type of quantitative analysis involves exponential smoothing, which smooths out spikes in demand, including seasonal variations, and may be useful when have less data available or want to focus a little less on seasonality.
Since quantitative forecasting predicts largely based on past and current sales and typically considers seasonal changes, it can be a good choice if any of the following is true:
-
You have a significant amount of data available.
-
Your data goes back at least a year, so you can track seasonal fluctuations.
-
Seasonal fluctuations significantly impact your brand’s volume or sales velocity.
Trends Forecasting
Trends forecasting also uses past sales or market growth to predict future sales and growth. However, it also focuses on broader market trends within your company, in your industry, and in the economy at large, including emerging trends, and excludes seasonal fluctuations from the analysis.
For retail businesses, this method might be an important part of your demand forecasting techniques since retail purchases are often driven by trends. Several types of external trends might impact your business and make this method even more relevant to your brand, such as:
-
What’s happening and popular on social media today, this week, this year.
-
Broader changes in fashion or lifestyle preferences.
-
Economic shifts, such as a recession, growth, or an event like COVID.
-
Generational buying shifts, whether it’s a change in purchasing patterns as generations reach different stages in life, or a change in buying power as a generation’s earnings increase or decrease.
Graphical Forecasting
Graphical forecasting graphs sales data, creating a visualization that makes it easier to understand. It can help uncover trends that wouldn’t be obvious otherwise, since you can visually see movements up and down and repeating cycles.
This can be a good choice for your brand when:
-
You have sufficient data for graphing.
-
You and your team grasp a visual demonstration more rapidly than text.
-
Your business is especially trends-driven, and capturing these shifts is critical.
-
You’re concerned that you’re missing crucial trends and patterns that drive demand for your products.
Qualitative Forecasting
Qualitative forecasting reviews information from research rather than analyzing historical or trending numerical data. Gathering information may involve reviewing market expert opinions, conducting research panels or customer surveys, and looking at customer feedback from existing sales, for example.
This method is helpful in several circumstances, including the following:
-
You’re just starting your business and have little, if any, historical data to go on.
-
You’re launching a new product and don’t have sales data on it yet.
-
You want to combine qualitative analysis with your existing data for a more comprehensive and accurate overview of potential demand.
Given the complexity of retail businesses, which often sell a high volume of SKUs across an ever-changing market, combining forecasting methods instead of choosing just one can produce better results. You can make that easier to do by automating and centralizing collection of your forecasting data with an ERP.
What Mean Absolute Percentage Error Is and How It Helps Retail Brands
Mean Absolute Percentage Error (MAPE) measures whether inventory forecasting methods are staying on track. It shows how much actual sales varied from what inventory forecasting predicted, calculated in percentages.
The key word is absolute, because MAPE looks at the error percentage in either direction, negative or positive, instead of adding or averaging errors, which could cancel them out. For example, if you have 10% negative error for some products and 10% positive error on others, MAPE calculates a 10% error, not an average 0% or cumulative 20%.
Measuring in percentages, not units, makes MAPE relevant to retail. It lets you see the extent of forecasting issues consistently across different SKUs, seasonal and year-round sales, and selling volumes. A 100-unit prediction that’s off by 10 has a 10% MAPE, while a 1000-unit prediction that’s off by ten has a 1% MAPE.
You’ll still need to determine which direction your predictions are off (over or under stock) and why. Did an influencer’s share of your Shopify page send sales soaring, or was your lead time data outdated? MAPE alerts you to start asking the questions.
MAPE’s downside is that if you have extremely low volume on a particular item, the error rate can seem inflated. For example, if you stock and sell 5 of an item annually, even being off by 1 would be a 25% error. Human judgment is still needed to determine whether this is a critical error for your business.
How Automating Forecasting with AI Helps, and Why Human Judgement is Still Critical
Inventory forecasting starts by collecting information and data. If you’re selling on multiple storefronts, or online and in-store, to both retail and wholesale customers, or selling via agentic commerce, you need to pull in sales data from all those places.
You also need data from supply and delivery systems to determine how long it takes to get product to customers, from sales teams on sales cycles length, from accounting to determine costs and revenue that impact inventory decisions, and from HR to determine how staffing levels affect your ability to make and move inventory.
An AI-native ERP integration system like Tailor’s automates this data collection. Since its headless, composable ERP is modular, it easily connects to each software system you use and pulls all the information into one accurate, single source of truth.
Since it can continuously collect and reconcile data, it allows you to more easily use closed loop planning, adjusting your predictions and supply processes in real time. You can see what’s happening and make informed decisions about whether to react and how.
Decision making is still critical to the inventory forecasting process. Retail is complex and qualitative, not just quantitative, so a system that tries to run like an automated factory line will fail. A human still needs to make judgement calls based on context.
Tailor’s ERP is designed to work with you, automating information gathering, analysis, forecasting for you and making suggestions, but still pulling you into the decision-making process.
See how Tailor’s ERP can help you take control of your inventory and optimize your sales with a demo today.