When you’re selling just a small assortment of goods, it’s easy to see what’s moving — just walk into the warehouse or check your Shopify dashboard. Once you’re stocking more SKUs and selling through your online store, retail locations, and wholesale accounts, though, that quick glance to see what’s moving is no longer effective.
Some products might sell out in days. Others sit untouched for months on end. And you may not know which is which until you see your month-end report.
The sell-through rate gives retail brands a simple way to measure: divide the units you sold by the units you received during a set period. Then multiply by 100. The result tells you, product by product, what’s earning its spot and what needs attention.
What you’ll learn:
-
How to calculate sell-through rate, with a side-by-side example
-
What a good sell-through rate looks like by product category
-
How sell-through compares with inventory turnover, DSI, and sell-in
-
How to improve sell-through without giving away margin, from reorders to bundling
Why Sell-Through Rate Is Essential for Your Growing Business
Most businesses start with a tight, curated assortment. So you can easily see what moves vs. what doesn’t.
As the business grows, though, more SKUs, sales channels, and wholesale accounts are added. Some products sell out while others silently pile up in the corner of the warehouse.
Unfortunately, you may not realize how much has piled up until your cash flow is constrained. Eventually, you may feel like you have to resort to markdowns to free up cash, which hurts your margins. Your wholesale partners notice too: retail buyers track sell-through by brand, category, and style when deciding what to order.
Knowing how to calculate sell-through, what a good rate looks like for your category, and how to move slow stock without discounting your way out of healthy margins is vital as you grow. In fact, it’s necessary to grow.
How to Calculate Sell-Through Rate
Sell-through rate compares what you sold with what you had available to sell over a specific window, be it a week, a month, or a full season. You can calculate it for each SKU, a product category, a store, or an entire sales channel.
Sell-through rate formula = (Units sold ÷ Units received) x 100
Pick a time period, count the units you received during that period, and count how many of them sold. If you started the period with stock already on hand, add it to the units received so the math includes everything available to sell.
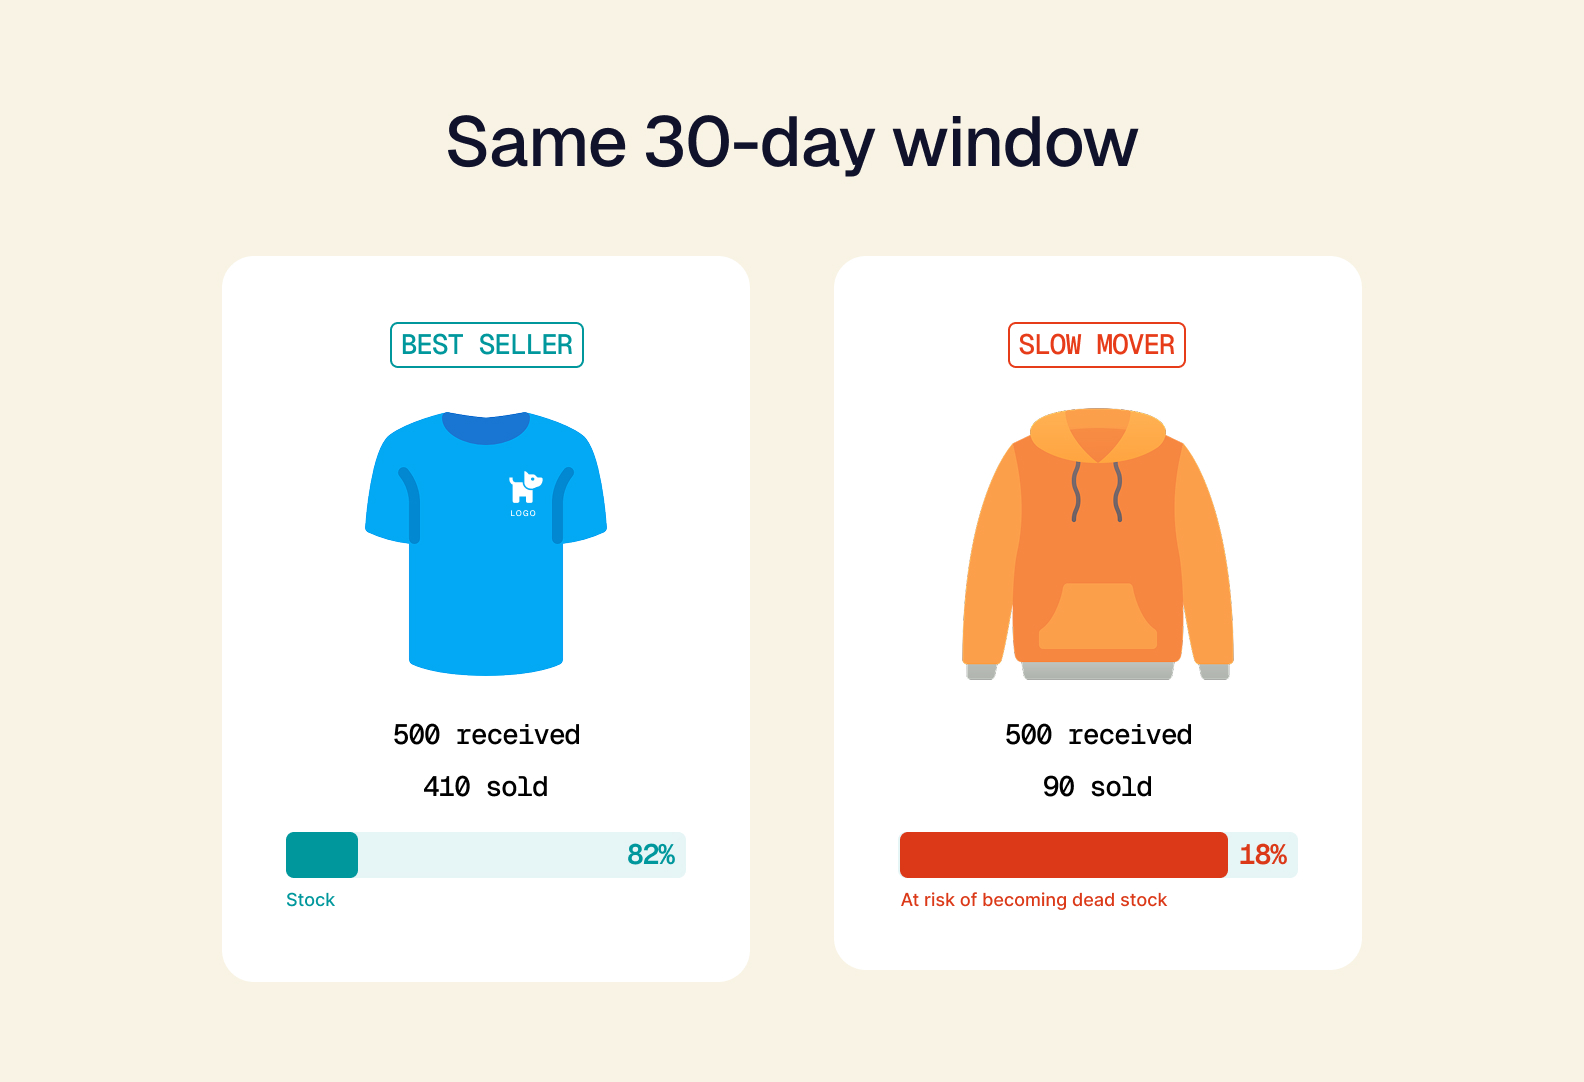
To see an example, look at two product examples from an apparel brand:
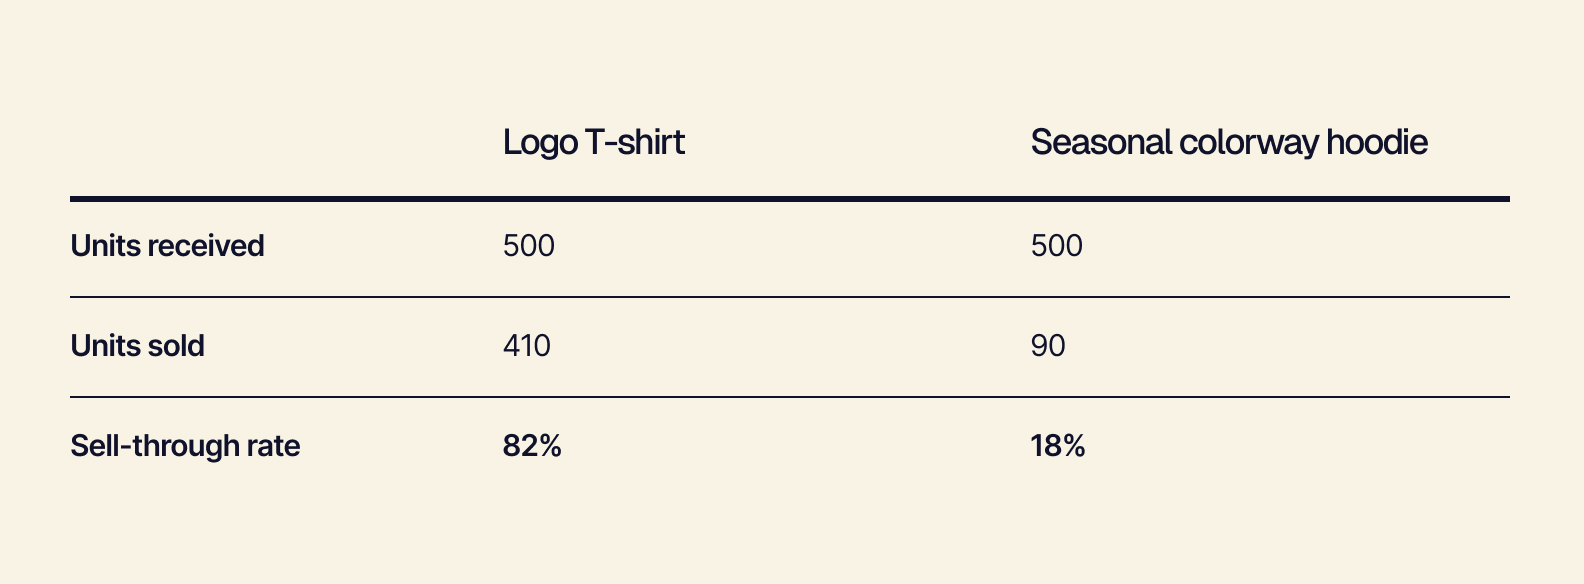
All green flags for the T-shirt — it’s selling steadily and, in fact, it’s about time to reorder. The hoodie, on the other hand, isn’t doing nearly as well. It’s sold fewer than one in five units. And if nothing changes, most of that stock will still be sitting in the warehouse next month… and the month after. Until eventually, that slow mover becomes dead stock.
What Is a Good Sell Through Rate? Benchmarks by Category
There’s no single number every retailer can or should hit. What’s good for one product or industry might be average or even low for another. A healthy sell-through rate depends on what you sell and how long you sell it. For instance, a trendy, affordable T-shirt is designed to sell fast. A black sapphire statement ring, with a higher price point and a longer consideration cycle, will naturally move more slowly. The time window is just as important, as the same product may show a 35% sell-through after four weeks yet 85% after 12.
That said, as a general rule of thumb, most retailers land between 40% and 80%, depending on the category, with an 80% sell-through rate considered strong.
Following Shopify’s general guidelines, depending on the category, these ranges could be good starting points:
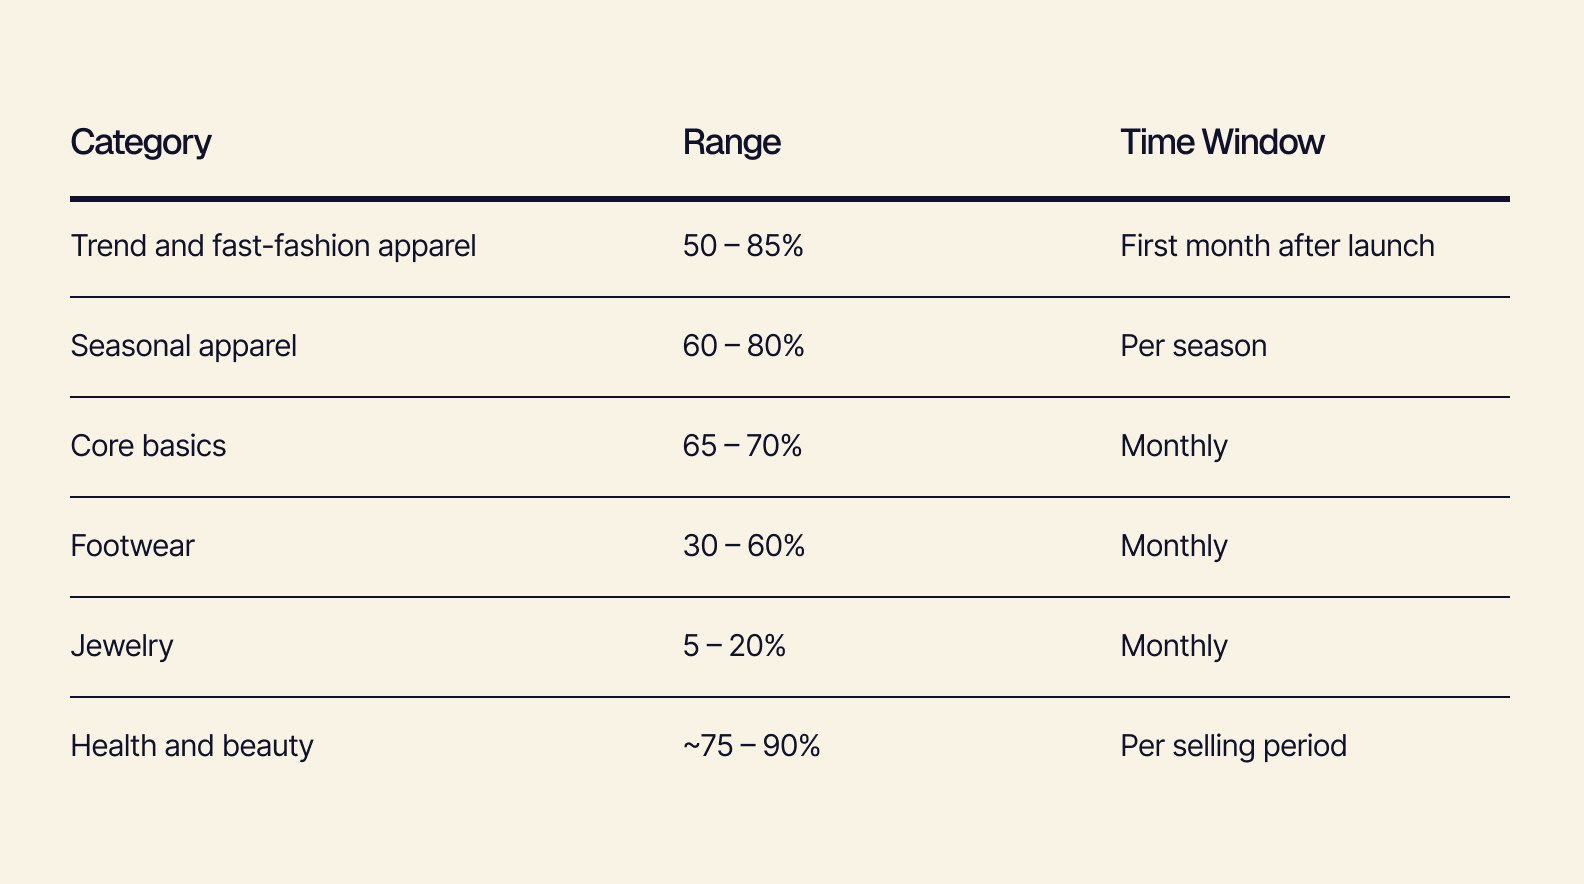
Keep in mind, these are rules of thumb, not hard targets. Your most reliable benchmarks are your own sales history, compared over the same window each time.
What about a sell-through rate that’s nearly 100%?
You may think it’s time to celebrate, but it’s not necessarily good news either. In fact, it’s often a sign that your demand outran your supply and you sold out, which can lead to missed sales. If a product sells out consistently, that’s a good sign you need to reorder sooner or buy deeper next time.
Sell-Through vs. Inventory Turnover vs. DSI
Sell-through rate often gets mixed up with two other inventory metrics: Inventory Turnover and DSI. They’re related, but each one answers a different question:
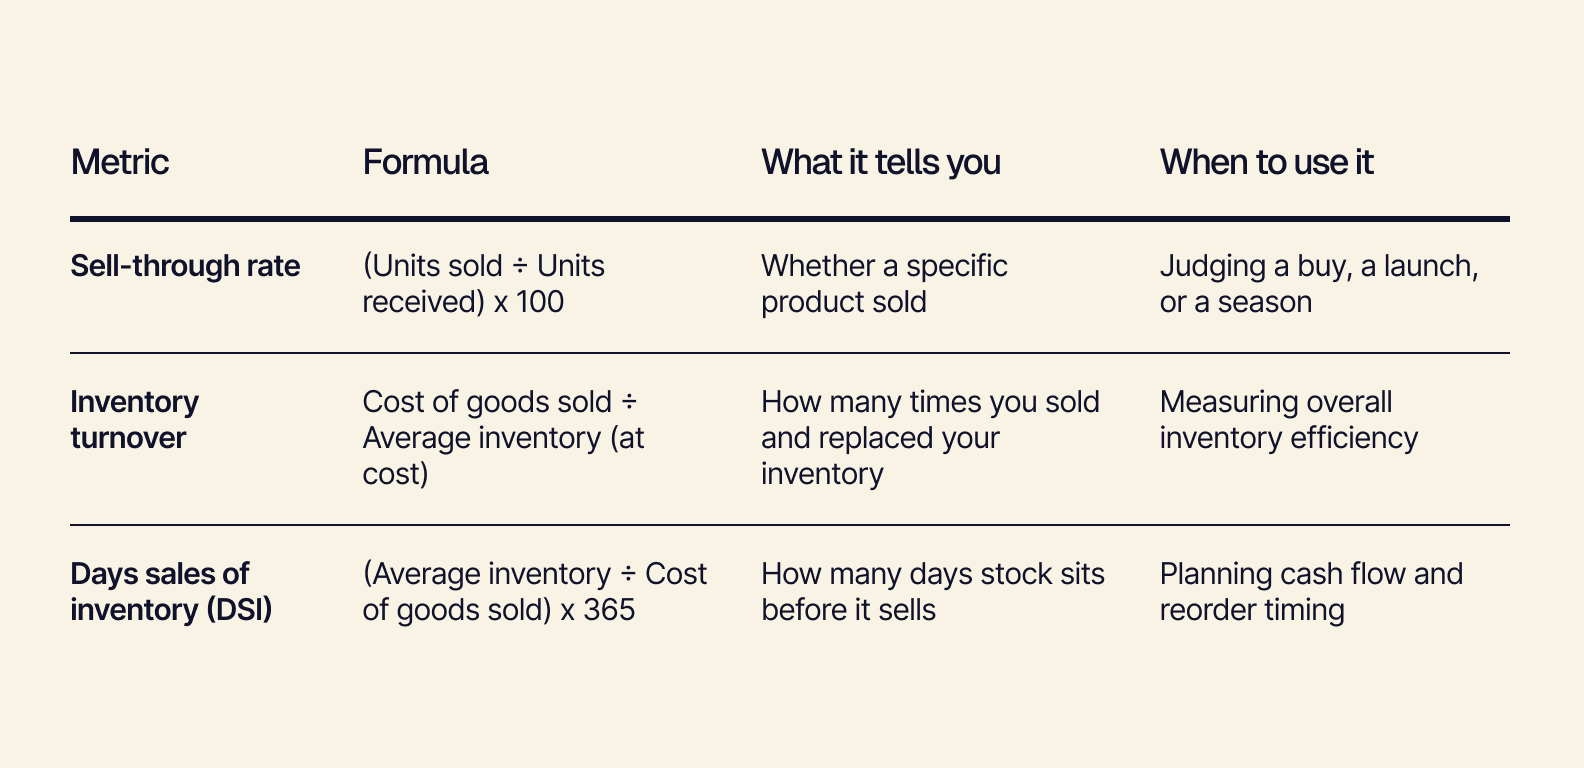
Sell-through is the most product-specific of the three, so it’s usually the first to flag a slow mover.
Sell-Through vs. Sell-In
If you sell wholesale, you’ll also track sell-in, which is the number of units your retail partners order from you. Sell-in shows how well a product sold to buyers. Sell-through shows whether it sold to their customers. Strong sell-in paired with weak sell-through usually leads to markdowns, returns, or smaller reorders next season.
Why Dead Stock Piles Up as Retail Brands Scale
Dead stock builds up over time as the data that would flag a slow mover is scattered across systems. That is, online orders are found in the Shopify dashboard, but in-store sales sit in your POS inventory system, and wholesale orders come in through a B2B portal or an email thread. So, at the end of the month, someone has to piece everything together in a master spreadsheet.
By the time you have a chance to review the report that shows the product isn’t moving, weeks of selling time are gone — as are your best options to fix it. Real-time ecommerce inventory tracking across every channel lets you spot a lagging SKU — while you still have time to act to protect your margin.
How to Improve Sell-Through Without Hurting Your Margins
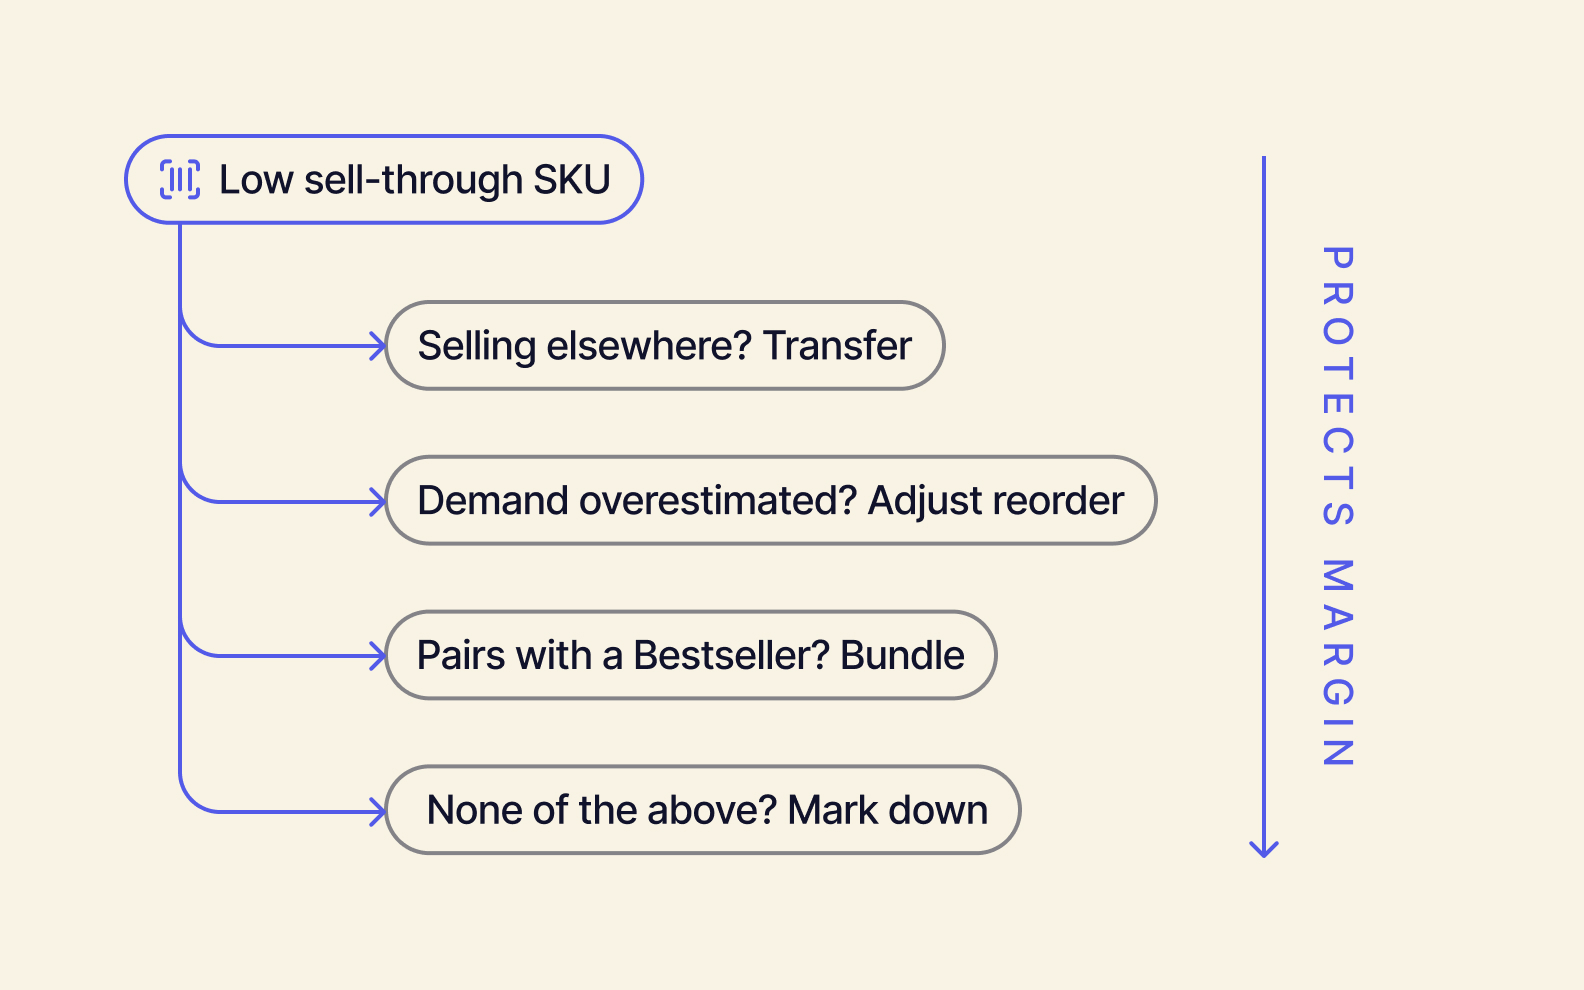
While slashing prices can be the fastest way to boost sell-through, it’s also the most expensive. By starting with other potential fixes — and saving discounts for last — you can often protect your margin.
Smarter Reorders and Demand Forecasting
Most buyers will tell you that low sell-through often starts with the purchase order. They aren’t wrong. If you, for instance, reorder based on last year’s numbers or, worse, a gut feeling, you’ll very likely end up overbuying products that are already slowing down.
To make better buys, base reorders on current sell-through by SKU. And use demand forecasting to account for seasonality and trends. Fortunately, AI-driven tools can now flag demand shifts much sooner.
Allocation and Transfers Between Locations and Channels
A product that’s stalling in one place may be selling well somewhere else. So, before you decide to discount, check the sell-through by store and channel. Moving stock from a quiet location to a busy one, or from the warehouse to the channel where it is selling, can often let you sell it at full price. Connected store operations make those transfers much easier to spot and manage.
See how Tailor’s inventory management gives you SKU-level sell-through across every channel in real time.
Bundling Slow Movers with Bestsellers
When Black Friday and other key selling times come around, the obvious move is to discount your bestsellers to get more people into your store (on- or offline). But often, those are the products that will likely sell anyway. So, the discount mostly gives away your margin.
Instead, keep those bestsellers at full price and then pair them with a slow mover. Using the example above, “Buy the logo T-shirt and get the seasonal hoodie at 40% off.” Or sell them together as a holiday gift set. The bestseller holds its price, and the slow mover finally moves. Plus, your customers feel like they got the best deal.
Just remember to track sell-through on both items separately, so a popular bundle doesn’t hide the lost full-priced sales.
Strategic Markdowns as a Last Resort
Even with the above strategies, some products won’t recover. When transfers, reorder changes, and bundles don’t succeed, a markdown frees up cash and space for the products that do sell. Make the markdowns deliberate by planning an early, modest markdown rather than a late, deep one. And most importantly, use what you learned to adjust your next buy
Tracks Sell-Through at the SKU Level, in Real Time
Every tactic above depends on spotting a slowing product while you can still do something about it. That’s challenging if your sales data lives in separate systems and only comes together in a month-end report.
Tailor brings sell-through for every SKU across Shopify, POS, and wholesale into one real-time view. It also supports AI-demand forecasting to help you buy smarter next time. As a headless ERP, it connects the tools you already use instead of replacing them. If you’re comparing systems, these are key ERP features worth looking for:
-
Inventory management
-
Order management
-
Purchase management
-
Cost accounting
-
Reporting and analytics
See how Tailor helps omni-channel retail brands keep the right stock in the right place: Request a Demo.